
Cambridge IELTS Book 18 Writing Task 1 Test 1
The chart below shows the number of households in the US by their annual income in 2007, 2011 and 2015. Summarise the information by selecting and reporting the main features, and make comparisons where relevant.
Number of US households (in millions), by annual income
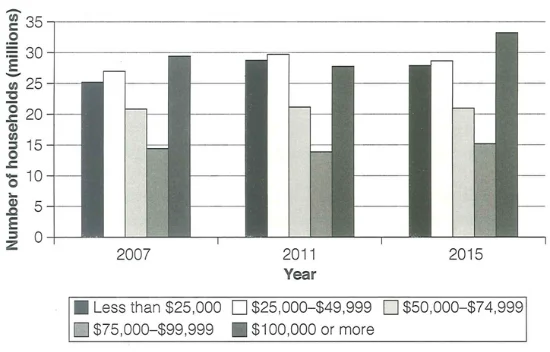
The chart categorizes US households into five income brackets for the years 2007, 2011, and 2015. Overall, the income distribution of US households remained consistent across these years, with fewer households earning between $50,000 to $74,999 and $75,000 to $99,999 annually. The highest income bracket of $100,000 or more saw a significant number of households in both 2007 and 2015, with approximately 30 million and 33 million households, respectively. The next largest groups in these two years included households in the two lowest income brackets: under $25,000 and between $25,000 and $49,999, each containing about 25 million to 28 million households.
However, 2011 presented a different trend. The number of households in the highest income bracket, around 27 million, was lower than the number in each of the two lowest brackets, which ranged from 28 million to 30 million. In all three years, the income brackets of $50,000 to $74,999 and $75,000 to $99,999 consistently held fewer households, with roughly 20 million and 15 million households, respectively, in these ranges. (180 Words)