Cambridge IELTS Book 17 Writing Task 1 Test 3
The table and charts below give information on the police budget for 2017 and 2018 in one area of Britain. The table shows where the money came from and the charts show how it was distributed. Summarise the information by selecting and reporting the main features, and make comparisons where relevant. This essay question is from Cambridge IELTS 17 Test 2 Writing Task 1.
Police Budget 2017-2018 (in £m)


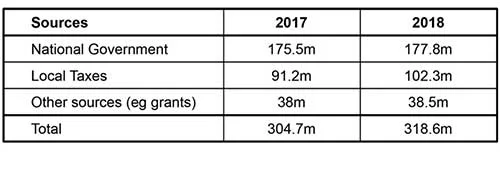
The table and pie charts provide details about the police budget for a specific area in Britain for the years 2017-18. The table outlines the budget’s funding sources, while the pie charts illustrate how the funds were allocated. Overall, the total police budget saw an increase, with the national government remaining the largest contributor in both years. Salaries continued to be the largest expense.
In 2017, the police had a budget of £304.7 million, which grew significantly to £318.6 million in 2018. The national government contributed the majority of the funds, increasing from £175.5 million to £177.8 million. Local taxes experienced the most significant rise, from £91.2 million to £102.3 million, while other sources contributed £38.5 million in 2018, just £0.5 million more than the previous year.
Expenditure was primarily allocated to officer and staff salaries, although this proportion decreased from 75% to 69%. In contrast, spending on technology almost doubled, rising from 8% to 14%, while the share spent on buildings and transport remained stable at 17%. (183 Words)
Use Different Grammatical Constructions to Describe Trends
- In 2017, the police had a total budget of £304.7 million, which rose significantly to £318.6 million in 2018.
- The majority of the money was sourced from the national government, with an increase from £175.5 million to £177.8 million.
- Other sources accounted for £38.5 million of the total budget in 2018, £0.5 million more than the previous year.
Remain Unchanged Vs Remain Constant
- Expenditure on buildings and transport remained unchanged/the same.
- Expenditure on buildings and transport remained constant.
I’m not saying “constant” is wrong” but it expresses some sense of continuity. In the pie charts, there are only two data points. In this case, it’s better to remove the sense of continuity and use “unchanged” or “the same”.
